Conversational Analytics & Text-to-SQL Studio
The Text-to-SQL Studio empowers business analysts, data scientists, and engineers to query complex enterprise databases using natural language. It translates business prompts into high-performance, dialect-tuned SQL queries, explains the underlying join logic, and provides one-click visual chart exports.
1. Dual-Tier AI Model Architecture
VDA supports a configurable dual-tier model hierarchy to balance data sovereignty, cost, and analytical depth:
flowchart TD
    Prompt["User Business Question"] --> Router{"Task Router & Escalation Engine"}
    Router -->|Air-Gapped / Standard Query| Local["Local Model Tier (Ollama / Qwen / DeepSeek)"]
    Router -->|Complex Join / Deep Reasoning| Cloud["Frontier Cloud Tier (Optional / Enterprise)"]
    Local --> SQL["Dialect-Accurate SQL"]
    Cloud --> SQL
    SQL --> AST["PBAC AST Validator & Column Masker"]
AST --> Exec["Datasource Execution & Result Preview"]- Local Tier (Air-Gapped & High Privacy): Powered by self-hosted LLMs (e.g. Qwen 2.5, DeepSeek) running entirely inside your secure network perimeter via Ollama or vLLM. No prompt tokens or data samples ever leave your infrastructure.
- Frontier Cloud Tier (Complex Reasoning): For cross-schema analytics, nested CTEs, and deep business logic calculations. Utilizes dynamic prompt budgeting to transmit only necessary column schemas without row data.
2. Using the Text-to-SQL Studio
Step 1: Select Datasource Context
Choose the target datasource from the dropdown (e.g., Oracle Core Banking, Postgres Warehouse, Snowflake Finance). You can optionally select specific schemas or allow VDA's vector engine to identify candidate tables automatically.
Step 2: Formulate Your Query
Type your question in natural language into the query input box.
Prompt Examples:
• "Find the top 10 branch accounts by total credit balance in RETAIL_BANKING."
• "Calculate the monthly transaction failure rate by transaction type for the last 6 months."
• "Show customer accounts that had more than 5 international transfers this week."
Step 3: Review Generated SQL & Explanation
Click Generate SQL. VDA performs:
1. Semantic Table Pruning: Selects the exact top-K tables and columns relevant to your prompt using Qdrant HNSW vector search.
2. Dialect Customization: Generates syntax tailored to your engine (e.g., Oracle ROWNUM / FETCH FIRST, PostgreSQL INTERVAL, or Snowflake syntax).
3. Structured Explanation: Provides plain-English walkthrough of the join paths, filter clauses, and aggregations.
SELECT
    b.branch_code,
    b.branch_name,
    COUNT(a.acct_num) AS total_accounts,
    SUM(a.current_bal) AS total_balance
FROM retail_banking.branches b
JOIN retail_banking.accounts a ON b.branch_code = a.branch_code
WHERE a.acct_status = 'ACTIVE'
GROUP BY b.branch_code, b.branch_name
ORDER BY total_balance DESC
FETCH FIRST 10 ROWS ONLY;
Step 4: Execute & Preview Data
Click Run Query to execute the query against the database: - The PBAC engine validates the query AST against your permission profile. - Results are displayed in an interactive data grid with sorting, filtering, and pagination.
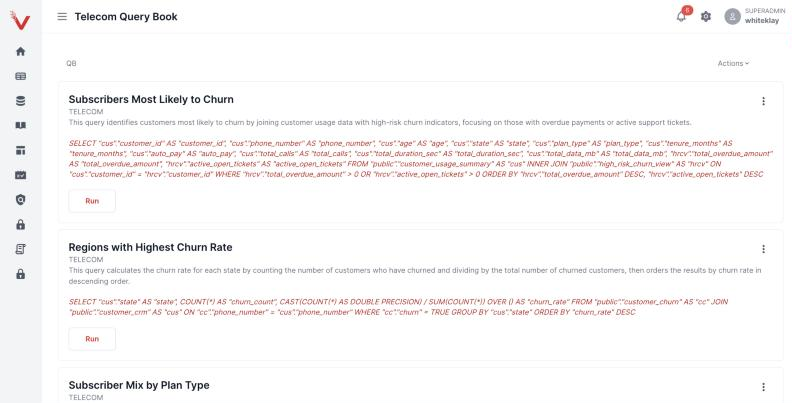
Saved Queries in a Query Book
Queries are organised in Query Books per datasource. Each entry shows a description, the generated SQL, and a Run button:
3. Exporting to Apache Superset Charts
Transform query results into production dashboards with a single click: 1. In the query results panel, click Export Chart. 2. Select your visualization type: - Bar / Column Chart: Categorical comparisons (e.g., balance by branch). - Line Chart: Time-series trends (e.g., daily transaction volume). - Pie / Donut Chart: Distribution breakdown (e.g., loan types). - Data Table: Tabular view with conditional formatting. 3. Configure the X-Axis (Dimension) and Y-Axis (Metric). 4. Click Publish to Superset. VDA creates the virtual dataset and chart in Superset and provides a direct launch link.